For my blog readers this is a contrarian approach to the trend of the price of gold.It works well when the sentiment gets so negative about the price of a commodity. Short covering MAKES THE TRADE.Good luck.
Change = Opportunity = Gold
Let's face it, without change, there can be no opportunity. As traders and investors, we need to see change in order to make money.
One potential opportunity in 2014 could be gold. In 2013, gold suffered what was perhaps its worst performance as an asset in decades, losing over 25% of its value for the year. This was the first time that gold had a year-to-year loss that I can remember. So in 2014, the question has to be, what's going on with gold and is it going to redeem itself?
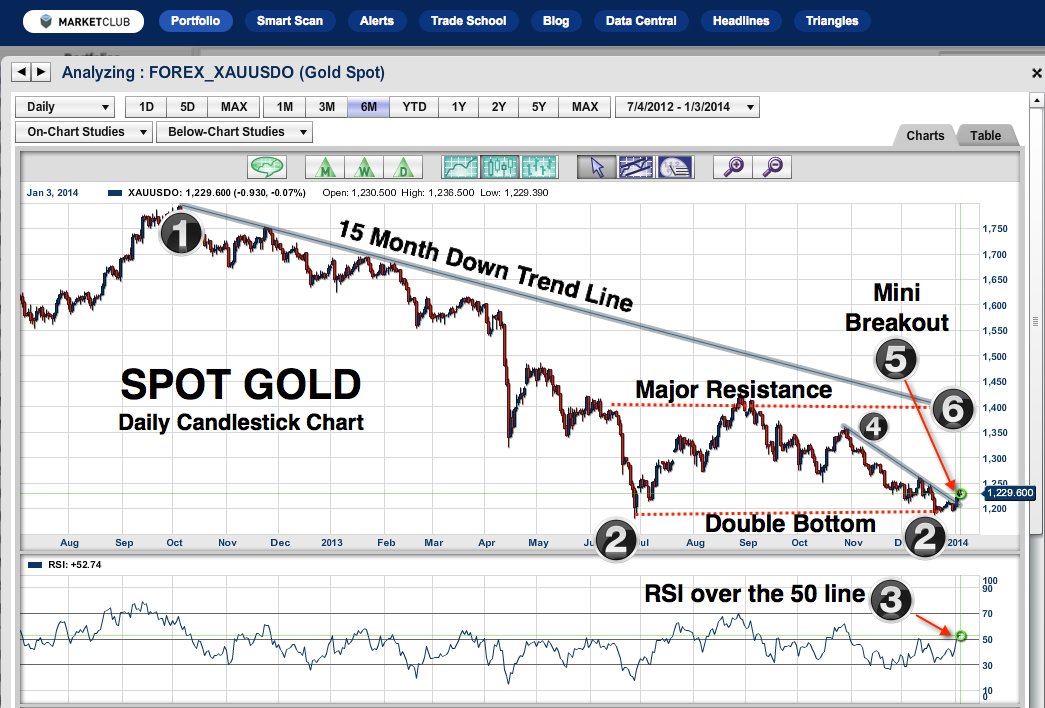
Looking at the chart which begins in July of 2012, you can see that gold hit its high and then basically for the next 15 months moved consecutively lower. This high is not the all-time high that was seen in August of 2011 at $1904, but the most significant high for our chart work.
The 15-month trend line (1) is the overriding technical aspect for this market in my opinion. The second most important element to this chart is the potential of a double bottom (2), which comes in around the $1,185 level.
1. 15-month downtrend line
2. Double bottom
3. RSI indicator above 50
4. 2-month downtrend line
5. Mini breakout
6. Major resistance at $1,400
2. Double bottom
3. RSI indicator above 50
4. 2-month downtrend line
5. Mini breakout
6. Major resistance at $1,400
On (3), the RSI line moved over 50, indicating that the trend could now be moving higher. Please be aware that this is different from the Trade Triangle technology, which remains neutral to negative.
On (4) I see a mini trend line which has been broken, indicating that a mini uptrend is in place at (5).
Number (6) indicates where major resistance is for gold at the $1,400 level. This area could also be a potential “pivot point” for a double bottom (2) that was formed in July and December 2013. Should that be the case, once the $1,400 level is broken on the upside, a strong argument can be made that gold could move up to the $1,600 level based on the pivot point swing. This level coincides nicely with a Fibonacci retracement of $1,568, not shown on this chart.
The Trade Triangle technology will also need to kick in and confirm that the trend is indeed on the upside. I want to watch very carefully in the days and weeks ahead to see if the weekly Trade Triangle kicks in. The weekly Trade Triangle is the one that's used for the trend in gold. I do not expect the monthly to kick in for some time, so the trend may be somewhat erratic until that happens.
The potential for gold to rebound is fairly strong with Janet Yellen as the new Fed chairman. Her job as the new Fed Chair is to get out of this crazy experiment that the Fed began four years ago with quantitative easing. The only way I can see this happening is basically the return of inflation which will be good for gold and perhaps, not so good for equities.
Conjuncture aside, I will of course always go with the tried and true, market-proven Trade Triangle technology.
Here's to a very successful 2014 for all of our members, traders and friends.


